
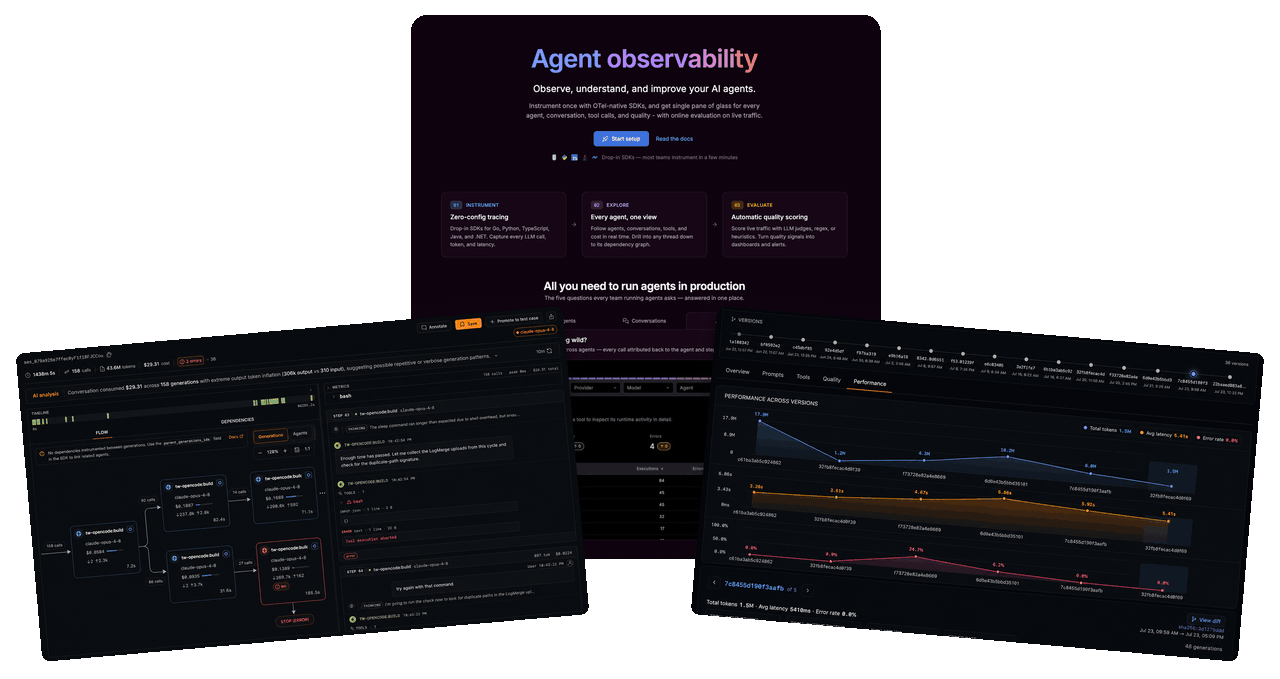
Grafana Agent Observability is the product Grafana Labs built because its own agent outgrew dashboards. Grafana Assistant went from internal hackathon project to generally available in a little over six months, and the team's own account of that period — prompt, tool-set, and harness contributions piling up from multiple teams, bespoke dashboards no longer cutting it — is the most credible origin story in the LLM-observability market, because the pain was self-inflicted before it was a SKU. The tool went generally available to Grafana Cloud users on July 30, 2026, was one of six AI capabilities Grafana shipped GA during its inaugural AI Week, and got its follow-up headline at ObservabilityCON on October 20, 2026: OpenTelemetry support, also GA, with Grafana citing its 2026 survey's 76% OpenTelemetry adoption figure as the reason agent telemetry should ride the same open standard as everything else.
This review is based on the shipped artifacts, not the launch narrative. We ran the agento11y Python SDK (v0.23.0, the current release of the open-source instrumentation layer) against a local wire sink and a real OpenTelemetry provider stack — no Grafana Cloud account required for the mechanics — and captured the actual span attributes, metric datapoints, and ingest payloads the product ships. We then read the parts of the SDK that the marketing does not mention. There is a genuinely strong product underneath: the fifth telemetry signal framing (agent sessions alongside metrics, logs, traces, and profiles) is not vapor, the evaluation and experiment tooling is deeper than most competitors', and Grafana is unusually honest in its own docs about the failure modes. But there are sharp edges you must price in before you wire this into a production agent: guards that fail open by default, a two-pipeline architecture with silent failure paths, a redaction model with deliberate (and undocumented-in-marketing) gaps, and a generation meter that costs 4.3x Datadog's per-unit list rate at the mid scenario.
What you are actually buying
Agent Observability is a Grafana Cloud surface with two distinct halves that share one backend:
- Observability for agents you build: thin SDKs (Go, Python, TypeScript, .NET, Java) that record every LLM generation — prompts, responses, tool calls, workflow steps, token usage, cost — plus provider adapters for OpenAI, Anthropic, and Gemini, and framework integrations for LangChain, LangGraph, OpenAI Agents, LlamaIndex, Google ADK, Strands Agents, Claude Agent SDK, LiteLLM, Pydantic AI, and Vercel AI SDK. The SDK is Apache-2.0 open source (
github.com/grafana/agento11y); the backend that makes the data useful is a Grafana Cloud feature. - Observability for coding agents you use: a launcher binary (
agento11y login, thenagento11y codexorclaudeand so on) that captures sessions from Cursor, Claude Code, Codex, Copilot CLI, OpenCode, Pi, Vibe, and the experimental Kiro CLI — plus a separate Hermes plugin — so you can audit usage, cost, tokens, and tool behavior across every coding agent your team runs, in one place, without touching application code.
On top of the raw telemetry sit the three capabilities that differentiate this from a plain tracing backend: online evaluations (judge/regex/JSON-schema/heuristic scorers running over live traffic, with alerting and SLOs), guards (synchronous preflight checks that can redact or deny a request before the model sees it), and experiments (versioned test suites, offline runs, and CI gates). The internal codename lineage is visible everywhere — the old grafana/sigil-sdk URL 301-redirects to the renamed repo, your access-policy token still needs a scope literally named sigil:write, the ingest-redaction feature flag is sigil.guards-ingest-redaction, and the SDK still honors legacy SIGIL_* environment aliases. That is not a criticism — it is a useful signal that this shipped fast from internal tooling, and it tells you what to expect from API stability (more below).
Architecture: two pipelines, and the silence between them
The single most important thing to understand before instrumenting anything is that Agent Observability is fed by two independent pipelines that do not know about each other. This is documented — Grafana deserves credit for writing a whole concept page about it — but it will still bite teams who copy the quickstart and skip the OpenTelemetry section:
graph LR
  subgraph APP["Your agent process (agento11y SDK)"]
    C["Client"]
    P["OTel TracerProvider and MeterProvider (YOU register these)"]
  end
  C -->|"POST /api/v1/generations:export - JSON record: prompts, outputs, usage, tags, metadata"| ING["Agent Observability ingest endpoint"]
  P -->|"OTLP export: gen_ai spans and histograms"| GW["Grafana Cloud OTLP gateway (separate credential)"]
  ING --> AO["Agent Observability: conversations, evaluations, guards, experiments"]
  GW --> AN["Analytics: cost, latency, token dashboards, traces"]
  AO --> UI["One UI, five signals"]
  AN --> UI
- Pipeline one — generation export: prompts, responses, token usage, tool calls, and workflow steps go to a dedicated Agent Observability ingest endpoint (
https://agento11y-prod-<region>.grafana.net) as JSON over HTTP or gRPC, authenticated with a Grafana Cloud instance ID and API token. This is what populates conversations and everything built on them. - Pipeline two — OpenTelemetry: spans and metrics (
gen_ai.client.operation.duration,gen_ai.client.token.usage,gen_ai.client.time_to_first_token,gen_ai.client.tool_calls_per_operation, plus generation spans) are emitted through OpenTelemetry providers your application registers — the SDK deliberately does not create them. This is what populates the analytics dashboards, and cost is derived server-side from the token-usage metric plus the model name: no token metrics means no cost data, even though every conversation arrived intact.
The failure mode is exactly as Grafana's own OpenTelemetry Setup page describes it, and we reproduced it in a clean process: if your application never registers a TracerProvider and MeterProvider, the OTel API hands the SDK a no-op provider, every metric is discarded in-process, nothing is logged, and the product looks healthy — conversations keep arriving, analytics stays empty. A second silent variant: the generation-export credential and the OTLP credential are different (Basic auth with instance ID and a glc_ token for OTLP), and Grafana's docs state plainly that a token missing the OTLP metrics scope fails silently from the application's point of view. During our own test we also found the inverse is worth knowing: in Python, the OTel API's proxy provider can mask the wiring-order mistake — registering the MeterProvider after constructing the client still delivered metrics in our harness. Treat "providers before client, shutdown providers after client.shutdown()" as the contract regardless; per-process you only get one set_tracer_provider call, and the re-set attempt logs Overriding of current TracerProvider is not allowed.
The hands-on wire contract, captured
Everything below is real output from a test harness running agento11y 0.23.0 on Python 3.14: one manual generation (no live LLM call — the SDK records whatever you hand it), one tool execution nested inside it, an in-memory OTel metric reader, a printing span exporter, and a local HTTP sink standing in for the Grafana Cloud ingest endpoint. This is the exact data the product receives.
pip install agento11y              # core SDK (OTel deps included)
pip install "agento11y[otel]"      # optional: opentelemetry-util-genai helpers
pip install agento11y-langgraph    # one optional package per framework

export AGENTO11Y_ENDPOINT="https://agento11y-prod-example.grafana.net"
export AGENTO11Y_AUTH_TENANT_ID="12345"       # Grafana Cloud instance ID
export AGENTO11Y_AUTH_TOKEN="glc_example"     # scopes: sigil:write metrics:write traces:write
export AGENTO11Y_TAGS="team=platform,env=prod"
from opentelemetry import trace, metrics
from opentelemetry.sdk.trace import TracerProvider
from opentelemetry.sdk.trace.export import BatchSpanProcessor
from opentelemetry.exporter.otlp.proto.http.trace_exporter import OTLPSpanExporter
from opentelemetry.sdk.metrics import MeterProvider
from opentelemetry.sdk.metrics.export import PeriodicExportingMetricReader
from opentelemetry.exporter.otlp.proto.http.metric_exporter import OTLPMetricExporter
trace.set_tracer_provider(TracerProvider()) # 1. providers BEFORE the client
trace.get_tracer_provider().add_span_processor(BatchSpanProcessor(OTLPSpanExporter()))
metrics.set_meter_provider(MeterProvider(metric_readers=[
PeriodicExportingMetricReader(OTLPMetricExporter()),
]))
from agento11y import (Client, GenerationStart, ModelRef, TokenUsage,
assistant_text_message, user_text_message)
client = Client() # 2. client AFTER providers; reads AGENTO11Y_* env vars
with client.start_generation(GenerationStart(
conversation_id="conv-42",
agent_name="support-agent",
agent_version="1.4.0",
model=ModelRef(provider="openai", name="gpt-5"),
)) as rec:
rec.set_result(
input=[user_text_message("Summarize today's incidents.")],
output=[assistant_text_message("Two SEV-2s, both mitigated.")],
usage=TokenUsage(input_tokens=812, output_tokens=140, total_tokens=952,
cache_read_input_tokens=256, reasoning_tokens=12),
)
if rec.err() is not None: # local SDK errors only, never provider errors
raise rec.err()
client.shutdown() # 3. then shut your OTel providers down lastWith that wiring, the SDK emits exactly the contract its docs promise. The captured generation span carries the OpenTelemetry GenAI semantic-convention attributes (gen_ai.*) plus the product-specific agento11y.* identity fields; the tool-execution span carries tool identity and — under the default capture mode — none of the arguments or results:
SPAN: execute_tool db_query | status: OK
    agento11y.sdk.name = 'sdk-python'
    gen_ai.operation.name = 'execute_tool'
    gen_ai.tool.call.id = 'call_1'
    gen_ai.tool.name = 'db_query'
    gen_ai.tool.type = 'function'

SPAN: generateText gpt-5 | status: OK
    agento11y.generation.id = 'gen_2ac29c3e70bd0e37'
    agento11y.sdk.name = 'sdk-python'
    gen_ai.agent.name = 'pm-harness'
    gen_ai.agent.version = '0.1.0'
    gen_ai.conversation.id = 'conv-otel'
    gen_ai.operation.name = 'generateText'
    gen_ai.provider.name = 'openai'
    gen_ai.request.model = 'gpt-5'
    gen_ai.usage.input_tokens = 812
    gen_ai.usage.output_tokens = 140
    gen_ai.usage.cache_read_input_tokens = 256
    gen_ai.usage.reasoning_tokens = 12
The metric side is where the cost story lives. gen_ai.client.token.usage is a histogram (unit {token}) that emits one datapoint per token bucket — input, output, cache_read, cache_write, reasoning — each labeled with agent name, agent version, provider, model, and operation. This is the series the backend multiplies by model prices to produce your cost panels, which is why a broken OTel pipeline silently zeroes your cost data while conversations keep flowing:
METRIC: gen_ai.client.operation.duration | unit: s
   attrs: gen_ai.operation.name='generateText', gen_ai.provider.name='openai',
          gen_ai.request.model='gpt-5', gen_ai.agent.name='pm-harness',
          gen_ai.agent.version='0.1.0', error.type='', error.category=''
   count: 1 | sum: 0.002133

METRIC: gen_ai.client.token.usage | unit: {token}
   attrs: gen_ai.token.type='input'    | count: 1 | sum: 812
   attrs: gen_ai.token.type='output'   | count: 1 | sum: 140
   attrs: gen_ai.token.type='cache_read' | count: 1 | sum: 256
   attrs: gen_ai.token.type='reasoning' | count: 1 | sum: 12
   (every datapoint also carries agent, version, provider, model, operation labels)

METRIC: gen_ai.client.tool_calls_per_operation | unit: count
   attrs: gen_ai.provider.name='openai', gen_ai.request.model='gpt-5',
          gen_ai.agent.name='pm-harness', gen_ai.agent.version='1.4.0'
   count: 1 | sum: 0
That last datapoint deserves an explanation, because it looks like a bug and is not one — and it is the kind of nuance you only get from reading the source. Our harness ran a real tool execution inside the generation, yet gen_ai.client.tool_calls_per_operation recorded 0. The SDK source (client.py, _tool_calls_histogram.record) shows the histogram records the count of tool-call parts on the generation record's output — the tool calls your provider adapter maps into the generation itself — not sibling tool-execution spans started via start_tool_execution, which are tracked in operation.duration with a gen_ai.tool.name label instead. If you hand-instrument tools with start_tool_execution and never put tool-call parts on the generation output, this histogram reads zero while tool traffic is plainly visible in traces and on tool spans. Know which path your framework adapter uses before you build a dashboard on this metric.
The generation export itself is a plain JSON POST — no protobuf, no proprietary framing on the HTTP path — to /api/v1/generations:export, with workflow steps on a sibling /api/v1/workflow-steps:export. Here is a real record from our sink, including the redaction results we asked for (next section), with the record's own metadata showing the SDK identifying itself and its effective capture mode:
{
  "generations": [{
    "id": "gen_w01d",
    "conversation_id": "conv-wire",
    "agent_name": "pm-harness",
    "agent_version": "0.1.0",
    "operation_name": "generateText",
    "mode": "GENERATION_MODE_ONCE",
    "system_prompt": "Internal tool. Env: PASSWORD=[REDACTED:env-secret-value] and token [REDACTED:grafana-cloud-token].",
    "input":  [{"role": "MESSAGE_ROLE_USER",
                "parts": [{"text": "Please email yuval@example.com the summary. Also sort key: name."}]}],
    "output": [{"role": "MESSAGE_ROLE_ASSISTANT",
                "parts": [{"text": "Done. Stored credentials: PASSWORD=hunter2, key [REDACTED:aws-access-token], reach me at [REDACTED:email]."}]}],
    "tags": {"team": "platform"},
    "metadata": {"agento11y.sdk.name": "sdk-python",
                 "agento11y.sdk.content_capture_mode": "no_tool_content",
                 "note": "rotate the AKIAIOSFODNN7EXAMPLE key soon"},
    "usage": {"input_tokens": "64", "output_tokens": "32", "total_tokens": "96"},
    "model": {"provider": "openai", "name": "gpt-5"}
  }]
}
Read that payload carefully — it is the whole privacy model in one record, and every anomaly in it is behavior we can trace to a documented rule. Note also the usage values arriving as JSON strings: a protobuf-int64 serialization quirk that does not matter to the backend but will surprise anyone writing a mock ingest or parsing exports with a strict schema.
Content capture and redaction: the privacy model, empirically
Two separate mechanisms decide what leaves your process, and conflating them is the most common way teams mis-deploy this SDK. Capture modes decide which fields ship; the sanitizer scrubs secrets out of the fields that do ship. Neither strips metadata or tags — Grafana's own concept doc says it in bold, and our wire capture proves it: the record above shipped a metadata note containing a live-looking AWS key format, verbatim, while the same key inside the assistant text was redacted three fields over.
| Mode | Generation export | Generation span | Tool-execution span | Default for |
|---|---|---|---|---|
full | Everything: messages, thinking, system prompts, tool args and results, embedding inputs | Content attributes included | Arguments and results included | Nobody (opt-in) |
no_tool_content | Full generation content | Content attributes included | Args/results omitted (legacy opt-in exists) | All five core SDKs |
metadata_only | Structure only: roles, part kinds, tool names, MIME types, tokens, timings, IDs — all text, thinking, system prompts, titles, errors, media stripped | Content attributes omitted | Args/results omitted | All coding-agent plugins |
full_with_metadata_spans | Full content | Content omitted from spans | Equivalent to metadata_only | Nobody (opt-in) |
The built-in sanitizer (wired via create_secret_redaction_sanitizer(), or GenerationSanitizer in Go) redacts using a two-tier pattern table that Grafana says is adapted from a Gitleaks-style ruleset. Tier 1 is high-confidence secret formats (Grafana glc_ tokens, AWS AKIA keys, PEM blocks, connection strings); tier 2 is key/value heuristics (PASSWORD=, quoted "token": fields) which catch format-less secrets but false-positive on ordinary prose — so tier 2 is deliberately kept off assistant prose. We seeded a record with nine deliberately placed strings and captured what actually shipped. Every result below matches the documented tier matrix exactly:
| Seeded string and location | Documented policy | What actually shipped in our capture |
|---|---|---|
PASSWORD=hunter2 in system prompt | Tier 1+2 on system prompts | [REDACTED:env-secret-value] |
glc_... token in system prompt | Tier 1 high-confidence format | [REDACTED:grafana-cloud-token] |
AKIAIOSFODNN7EXAMPLE in assistant text | Tier 1 on prose | [REDACTED:aws-access-token] |
PASSWORD=hunter2 in assistant text | Tier 2 deliberately OFF for prose | Shipped verbatim — by design |
alice@example.com in assistant text | Email redaction on by default | [REDACTED:email] |
yuval@example.com in user prompt | User input untouched unless input redaction enabled | Shipped verbatim — default off |
| "sort key: name" in user prompt | The documented tier-2 false-positive example | Shipped verbatim (input redaction was off; enabling it would export "sort [REDACTED:env-secret-value]") |
AWS key inside metadata | Metadata is never stripped by any mode | Shipped verbatim — documented caveat, empirically confirmed |
| Tool arguments and results on spans | Default no_tool_content excludes them | Confirmed absent from every captured span |
The engineering judgment here is defensible — a heuristic that rewrites "sort key: name" into "sort [REDACTED:env-secret-value]" destroys forensic transcripts, so tier 2 stays off prose — but the security posture you actually get is: format-recognized secrets are caught everywhere; key/value-shaped secrets are caught only in prompts, tool I/O, and system prompts; user prompts are not redacted at all until you flip AGENTO11Y_REDACT_INPUT_MESSAGES=true on. A typo in that env var keeps redaction on (unrecognized values fall back rather than disable — a nice fail-safe), and the same flag exists per-field in code via SecretRedactionOptions.
Three more capture-model traps are worth their own bullets, all from the vendor's concept doc:
- Workflow steps are a redaction blind spot. LangGraph node state (captured with
capture_workflow_steps=True) usually contains the conversation messages and tool results, andno_tool_contentdoes not remove tool results from that state — nor does the generation sanitizer run on workflow steps at all. Onlymetadata_onlykeeps graph state out of the ingest channel. Teams that instrument LangGraph with the default mode are shipping full graph state — including tool results the generation export carefully excluded — through a side door. - The experimental OTel generation export upgrades privacy modes. In the mode where generations themselves travel as OTel spans,
full_with_metadata_spansresolves tofullin Go and Python — content can appear in spans that the mode name promises to protect. Grafana's doc's own words: "Do not use it to keep content out of generation spans." - Sanitizer parity gaps: the JS sanitizer validates and redacts tool-definition schemas; the Go, Python, and .NET sanitizers still lack equivalent tool-definition redaction. And in Go's
otelgenai, rawInvocation.Attributesbypass capture filtering and URI scrubbing entirely — callers must filter private attributes themselves.
For the coding-agent half there is a second layer: the plugins redact known secret formats out of every content field they export (both copies of tool payloads — generation and span), keep metadata_only as the default because coding agents run on shared machines, and an ingest-side redaction feature (feature-flagged sigil.guards-ingest-redaction) applies your redact rules at storage time, with genuinely hardened semantics: rules cached 10 seconds, toggles live within about 40, and if the ingester cannot load rules and has none cached, it fails closed — generations are rejected with a retryable HTTP 503 (redaction_unavailable) rather than storing unredacted content. Redacted records are tagged agento11y.redaction.ingest=true with the rule IDs and flagged in the UI. This is the right design; note the asymmetry with request-path guards, which fail open (next section).
One historical data point belongs in any honest review: the retired grafana-agento11y-hermes plugin at 0.10.0 shipped with full-content default and no shared-secret redaction — the current agento11y-hermes rename fixed that from 0.11.0, and Grafana's doc instructs you to uninstall the old distribution. A privacy default that wrong shipped in a plugin inside the last few months. The defaults are correct now, but that incident is your reminder to pin plugin versions and re-audit on every upgrade of a v0.x telemetry stack.
Online evaluations: the strongest surface, with honest limits
Evaluations are where Grafana's product is meaningfully ahead of the tracing-first competition, because the scores land next to the conversations they scored, in the same query surface as your cost and latency data. The mechanics: an evaluator defines how to score (four types: LLM judge, JSON schema, regex, heuristic — the same types guards reuse), and an evaluation rule binds selector, matching conditions, sampling rate, evaluators, alerts, SLOs, and actions. Rules start matching new traffic only — historical generations are never backfilled, so budget a ramp period before a pass-rate panel means anything.
The evaluator library is unusually substantive for a GA product. Beyond generic templates (PII identification, toxicity, helpfulness), Grafana ships: four AI Act readiness templates (fundamental-rights harm, human oversight, decision explanation, tool action safety), two HIPAA readiness templates (PHI unauthorized disclosure, PHI minimum necessary — the docs are explicit that PHI requires identity plus health information, generic PII is not enough), four deterministic secret-detection evaluators (private-key blocks, known formats, labeled credentials, connection strings — deliberately no generic high-entropy pattern, because false positives), and three trace-aware agentic-safety judges (prompt-injection resistance, tool-result groundedness, external-action authorization). Grafana is careful to label the compliance templates "evidence signals, not a finding of AI Act compliance" — that honesty is welcome, and you should take it literally: they cannot establish data governance, aggregate disparate impact, or that a human actually reviewed anything.
The LLM-judge path is the one to treat with respect. Judges are forkable templates with configurable prompts and context selectors (whole conversation, complete user turns, single generations; transcript variables like generation.latest_user_message, generation.agent_response, turn.transcript, and turn.transcript_detailed), the judge model returns a structured score that Agent Observability validates against your configured range — the judge cannot set its own pass/fail — and pass/fail derives from your threshold. Grafana's own trust-platform post links an external study on LLM-judge unreliability, which is the right instinct: generic judges are noisy, and the guidance to customize prompt and context per agent is correct. Operationally, know these limits before you alert on them:
- Judge costs are real and separately metered. Evaluations and guards burn their own token meter (pricing section below), the evaluations overview carries an AI-analysis bar that surfaces "most expensive evaluations by judge cost," and judge executions are labeled
eval_ai_request_provider/eval_ai_request_model— deliberately distinct from your agent'sgen_ai_request_*labels so a mislabeled dashboard cannot confuse judge spend with agent spend. - Edit history is capped at the last 10 recorded edits per rule, with side-by-side compare. For anything regulated, mirror rule definitions in Git.
- Custom code-based scores are a first-class escape hatch: your own classifier posts to
POST /api/v1/scores:exportwith a stablescore_id, the generation ID, and evaluator identity, and the result lands in the same conversation-detail and quality-reporting surfaces. This is the right design for proprietary scorers and it is easy to wire. - Alerts and SLOs ride Grafana's real machinery — evaluation alerts become editable Grafana Alerting rules, and an evaluation with a pass condition can provision a 28-day rolling SLO (labeled
agento11y_eval_slo="true") with burn-rate alerts, prefilled from your current pass rate once you cross 50 scores in 28 days. Deleting the evaluation deletes the SLO. - Failures feed the regression suite: actions can route failed (or passed) conversations into collections, and collections promote into versioned test-suite drafts — the loop that closes the gap between "the judge caught it" and "it can never ship again."
Guards: real request-path enforcement, with a fail-open default you must flip
Guards are the piece most teams will buy this product for and the piece with the sharpest edge. They are synchronous checks that run on your request path, before the LLM call — the SDK's hook calls Agent Observability, enabled guard rules evaluate in ascending priority order, and the response is allow, deny, or a sanitized transformed_input the SDK substitutes for your messages. Three guard types: evaluator guards (attach any evaluator; deny or warn on fail), redact guards (regex patterns; matches always replaced with the literal token [REDACTED]; redactions run before evaluators so a judge sees sanitized content), and tool-filter guards (glob patterns on tool names — shell_exec, Bash(*rm*) — where any pattern containing an open parenthesis also matches tool-call arguments, enabling argument-level blocking).
graph TD
  A["SDK evaluate_hook (preflight, disabled by default)"] -->|"request, messages, model, conversation_id"| G["Agent Observability guard service"]
  G -->|"allow"| P["Provider LLM call proceeds"]
  G -->|"deny"| D["SDK raises HookDeniedError"]
  G -->|"transformed_input"| R["Sanitized messages replace the original request"]
  G -.->|"service unreachable, timeout, or misconfigured: fail-open default"| P
  D -.->|"denied preflight is still visible in conversation detail"| V["Agent Observability"]
Now the edge. The vendor's guard guide states it in one line: "If the guard service is unreachable, the SDK proceeds by default (fail-open)" — hooks.failOpen=true is the default, with a client-side timeout (5,000 ms in the guards guide's settings table; the Python HooksConfig defaults its own timeout_seconds to 15.0 — verify your language's default, they are not identical). Worse, from the Python SDK README, with unusual candor: "The response carries no marker separating the two, so a fail-open allow otherwise looks like a completed evaluation." Your compliance story cannot distinguish "the PII guard approved this request" from "the guard service was down and the SDK waved it through." Only the LiteLLM integration does its own fail-closed handling around this. If guards are a hard requirement — and for anything touching PII or dangerous tools they should be — set fail_open=False on every client (it is a per-call override too), accept the availability coupling that creates, and alert on the guard Prometheus metrics (request rate and latency, allow/deny rates, per-rule evaluations) so an unreachable guard service pages someone instead of silently dissolving your policy.
Two smaller guard notes from the docs: hooks are disabled by default (hooks.enabled=false — nothing calls the guard service until you opt in per client), and denied preflights are still correlated and visible in conversation detail even though no generation was created, as long as you pass the same conversation_id to the hook and start_generation. Guard activity views cover the last 24 hours and up to 100 recent decisions per guard.
Experiments and CI gates: the loop, closed
The experiments surface is what turns the telemetry into a delivery process, and its object model is right: test cases (stable IDs, input, optional expected result/rubric) group into versioned test suites; an experiment run executes a candidate against them; each attempt is a trial; scores attach to trials, with exactly one primary_verdict per trial (multiple primaries are a report conflict) and any number of diagnostic scores that never affect pass rates; repeated attempts give you pass@k and pass^k for non-deterministic agents. Trials link back to the conversations, generations, and traces your instrumentation already produced — an aggregate regression drill-links to the exact transcript, tool calls, and evaluator explanation behind it. Grafana's own o11y-bench (~70 observability tasks, built on the open-source Harbor runner) publishes every model and reasoning configuration as public experiments, which is a genuinely useful public dataset for judging judge noise.
graph LR
  L["Live agent traffic"] --> EV["Online evaluation rules (judge, regex, JSON schema, heuristic)"]
  EV -->|"fail or pass conditions"| COL["Collections"]
  EV -->|"evaluator metrics"| AL["Grafana Alerting and 28-day SLOs"]
  COL -->|"promote, annotate"| TS["Versioned test suite"]
  TS --> EXP["Offline experiment run (trials, scores, artifacts)"]
  EXP -->|"checkpoint gate CLI exits 0, 1, or 2"| CI["PR merge gate"]
  EXP -->|"candidate metadata: git SHA, model, prompt version"| VER["Agent version tracked with diff, rollback ready"]
The CI path is real and shippable today. The SDK ships an experiments module that writes runs, trials, and scores through the same ingestion API key as generation ingest (no separate eval credential), finalizes runs as completed or failed — Ctrl-C finalizes as failed, which is correct — and the agento11y-checkpoint-gate CLI compares a candidate run against a baseline with exit codes you can wire directly into CI:
agento11y-checkpoint-gate --suite-id dashboard-regression --suite-version 3 \
  --baseline "$BASELINE_RUN_ID" --candidate "$CANDIDATE_RUN_ID" \
  --min-pass-rate 0.9 --max-drop 0.05
Details that will save you a debugging session: the gate exits 2 when either run cannot support the comparison (an errored case, or scores that do not match the version-pinned evaluators), and it needs every case to complete on its first attempt — one provider error invalidates the whole comparison, so rerun rather than argue with it. Stored test suites and cloud-side evaluators use a second credential (a Grafana service-account token for the control plane, roles Agento11y Reader/Admin), and if your stack's gateway is not routed for those endpoints you get 401 invalid scope requested — which the SDK docs warn looks like a token problem but is not. Server-side conflicts are well-typed (SCORE_COUNT_MISMATCH when a locally derived count contradicts stored scores, PENDING_EVALUATIONS when finalizing while a judge is still running) and recoverable by polling to terminal status and finalizing again. Experiment traffic is excluded from online evaluation by default (opt in per run with online_evaluations_enabled, immutable after creation) — test runs do not pollute production quality metrics, which is the correct default.
Cost attribution inside experiments has precise, documented semantics worth quoting in a design review: if your runner supplies a trial cost it is kept as-is; otherwise cost is computed from the trial's linked conversation usage using your configured price in force at the model's latest generation — adding a price after a run does not reprice the earlier run, and the monthly LLM-judge allowance uses catalog prices, not your configured ones. Missing cost displays as Unknown, not zero. Somebody at Grafana has been yelled at by a finance team before; these are the scars.
The coding-agent half, and the cardinality landmine
The launcher is the fastest time-to-value in the product: install the binary, agento11y login, launch your agent through it, and every Cursor/Claude Code/Codex/Copilot session lands as observable traffic — usage, cost, tokens, tools — with zero application code. The agento11y doctor command validates the wiring (and reports the exact tag values it will resolve in the current directory). Built-in per-generation tags include cwd, git.branch, and subagent; opt-in client tags (AGENTO11Y_AUTO_CODING_AGENT_TAGS) resolve user, repo, and branch as metric labels — agento11y_tag_user, agento11y_tag_repo, agento11y_tag_git_branch — which is what powers per-user and per-repo cost breakdowns.
Before you enable that switch, read Grafana's own cardinality warning, which is the best-written version of this trade-off we have seen from any vendor: the user value is commonly a work email, it becomes a Prometheus label, and it is kept for the metric retention period, which is longer than most log retention. Every distinct combination of label values is a new time series, and "a team that creates a branch per ticket adds a series per ticket, forever." Their advice — start with user,repo, add branch only if you genuinely need per-branch cost — is correct, and so is the operational footnote that pi and OpenCode plugins freeze their client (and therefore labels) at session start, while the hook-based agents rebuild per invocation and follow a mid-session checkout.
Pricing: three meters, generous included usage, honest arithmetic
Agent Observability bills on three separate meters: generations (each model call your agent makes), tokens consumed by LLM-based evaluations and guards, and the standard metrics/traces your SDKs send (billed as ordinary Grafana Cloud telemetry, separately). Free and Pro plans include 30,000 generations and 25 million evaluation/guard tokens per month — and note the allowance is shared with other Grafana Cloud AI features, so a stack already burning Assistant tokens eats from the same pot. Pro lists at $1.50 per 1,000 generations and $2 per 1M eval/guard tokens on top of a $19/month platform fee; Enterprise is custom with a $25,000/year minimum commitment. There is a free tier with the full included allowance, which makes the pilot phase genuinely free.
We scripted the scenarios (all assumptions stated; list rates; telemetry excluded):
| Scenario (stated assumptions) | Generations/mo | Billable generations | Generation cost | Judge tokens (rate x tokens/eval) | Judge cost | Usage total |
|---|---|---|---|---|---|---|
| Pilot — 25k generations, 10% judged at ~1.5k tokens each | 25,000 | 0 (within 30k included) | $0 | 3.75M (within 25M included) | $0 | $0/mo |
| Mid-size fleet — 500k generations, 10% judged at ~1.5k tokens | 500,000 | 470,000 | $705 | 75M (50M billable) | $100 | $805/mo |
| Large platform — 5M generations, 5% judged at ~1.5k tokens | 5,000,000 | 4,970,000 | $7,455 | 375M (350M billable) | $700 | $8,155/mo |
The comparison everyone will ask for: at list rates, a Grafana generation ($0.0015) costs 4.29x a Datadog LLM span ($0.00035 at 15-day retention, per Datadog's pricing list — and Datadog does not bill tool, retrieval, or embedding spans). At our mid scenario, that is roughly $805/month on Grafana's meters versus roughly $175/month on Datadog's narrow span meter — before the SKUs Datadog sells separately (guardrails, evaluation-type features) and before Grafana's included allowances push small deployments to zero. The unit-price comparison is honest but incomplete: what Grafana meters as a "generation" and Datadog meters as an "LLM span" is the same provider call, but only one of the two ships the evaluations/guards/experiments platform on the same bill and correlates it with your existing metrics, logs, traces, and profiles. Price the platform, not the unit — and for the full competitive landscape across LangSmith, Langfuse, Arize, and Datadog, see our LLM observability tools comparison.
One more pricing subtlety from the cost-optimization guide: custom-label cost breakdowns use public list prices, not your configured model prices or long-context rates — there is a visible "cost shown at list prices" notice — so tag-level breakdowns and recorded totals will disagree for anyone with negotiated rates. Configure your real model prices for recorded costs, and treat the breakdown as relative signal, not accounting.
Where it degrades: the conditions, documented and verified
| Condition | What happens | Source |
|---|---|---|
| No OTel providers registered in the app | Conversations arrive; analytics and all cost panels silently empty; nothing logged | Vendor OTel-setup doc; reproduced in our harness |
| OTLP token missing the metrics scope | Nothing exports; no error surfaces in the application | Vendor OTel-setup doc |
| Providers registered after client construction | Python's OTel proxy masked it in our test (metrics still flowed); docs still mandate providers-first — per-process you get one set call, re-sets log a warning | Our harness + vendor docs |
| Export endpoint down or slow | 5 retries with exponential backoff capped at 5s, per-request timeout 30s (AGENTO11Y_EXPORT_TIMEOUT_MS); while retries run, the 2,000-record in-memory queue can fill and newer generations are dropped; queues do not survive process restart | Python SDK README |
| Guard service unreachable | SDK proceeds (fail-open default); synthesized allow indistinguishable from a completed evaluation | Guards guide + Python SDK README |
| Ingest redaction rules unloadable | Fails closed: generations rejected with retryable HTTP 503, unredacted content never stored; rules cached 10s, toggles live in ~40s | Guards guide |
| High-cardinality client tags (user/repo/branch) | One new time series per distinct value combination, for metric retention; branch-per-ticket = a series per ticket, forever; emails persist as label values | Tags and metadata doc |
| LangGraph workflow steps in default mode | Graph state — messages and tool results included — exports through the workflow-step channel; the generation sanitizer does not run on workflow steps | Content capture modes doc |
| Evaluation rule created mid-stream | No backfill: scoring starts on new traffic only; pass-rate panels ramp from zero | Evaluation guide |
| Gateway not routed for experiments endpoints | 401 invalid scope requested — a routing failure masquerading as a credential problem | Experiments guide / Python SDK README |
Honest weaknesses
- The dual-pipeline design makes partial failure invisible. Two credentials, two exporters, two failure modes, zero cross-alerting. Every deployment needs a synthetic canary generation and a metric presence check (Grafana's own troubleshooting table is the checklist) or you will discover the break at quarter-end when the cost dashboard is blank.
- Fail-open guards with no audit marker. The default posture is that your policy enforcement evaporates with the guard service, and the SDK cannot tell you it happened. For a compliance buyer this is the single most important configuration change to make on day one.
- Durability is process-local. A 2,000-record in-memory queue with no spool: a 90-second ingest outage at moderate traffic drops generations permanently. Fine for most monitoring; not fine if you treat the conversation store as your system of record for AI behavior audits.
- v0.x velocity is a liability as much as a feature. The Python SDK went 0.10.0 to 0.23.0 between July 21 and mid-November 2026; the repo was renamed from sigil less than a year after creation; token scopes and feature flags still carry the old name; a plugin shipped with full-content default and no secret redaction as recently as 0.10.0 (fixed in 0.11.0). Pin versions, read release notes, re-audit capture defaults after every upgrade.
- Per-unit cost is premium. $1.50/1k generations is 4.29x Datadog's per-span list rate at the same volume. The included 30k/25M allowance and the bundled eval platform soften it, but heavy-generation, low-judging workloads pay the full premium for capability they may not use.
- Cloud-first surface. The documented, priced, supported product is Grafana Cloud. The SDK's auth modes (tenant/bearer,
X-Scope-OrgID) hint at self-hosted ingest paths for enterprise deployments, but Grafana publishes no self-managed Agent Observability deployment docs or pricing — if your answer is "on-prem only," this is not currently your product. - Metric contract fine print.
gen_ai.client.tool_calls_per_operationcounts tool-call parts on the generation record, not tool-execution spans; token buckets need thegen_ai_token_semanticslabel checked before you add cache buckets to input (inclusive semantics double-count cache reads); tool-span durations carry empty agent/model/provider dimensions unless you set them. None of this is hidden, all of it will burn two days of someone's week.
Who should skip this
- Teams with no agents in production. The free tier is genuinely free, but the product's value starts when there is live traffic to evaluate and regressions to catch. Instrumenting a prototype you rewrite weekly buys you dashboards, not trust.
- Compliance regimes that cannot tolerate SaaS conversation storage. If full prompts in a multi-tenant cloud are out of bounds,
metadata_onlyneuters the entire conversation feature set — at that point you are paying Grafana prices for what standard OTel GenAI instrumentation plus your own backend already does, and you should do that instead. - Self-hosted-only Grafana shops. OSS Grafana does not ship this surface; your Grafana Enterprise investment does not currently buy it back. Revisit if Grafana documents a self-managed path.
- Teams already running a working eval loop elsewhere. If Langfuse self-hosted or LangSmith already owns your traces, prompts, and evals with real adoption, the differentiator left on the table is correlation with your non-AI telemetry — weigh that against re-instrumenting every agent and rebuilding every judge.
- Anyone who needs guaranteed synchronous enforcement today. Guards fail open by default, the enforcement surface is months old, and the guard activity window is 24 hours. If the requirement is "PII can never reach the model, full stop," deploy a dedicated policy enforcement point that fails closed as the boundary, and use Agent Observability guards as detection and redundancy.
Querying it like you own it
Because the metric contract is standard OTel, everything lands in Grafana Cloud Prometheus with dot-to-underscore name and label conversion, and the docs' cache-semantics warning is the one thing to internalize before writing token arithmetic:
# Token usage by bucket over 24h (input, output, cache_read, cache_write, reasoning)
sum by (gen_ai_token_type) (increase(gen_ai_client_token_usage_sum[24h]))

# Operation rate and average duration per agent
sum by (gen_ai_agent_name) (increase(gen_ai_client_operation_duration_count[24h]))
rate(gen_ai_client_operation_duration_sum[5m])
  / rate(gen_ai_client_operation_duration_count[5m])

# Check semantics BEFORE adding cache buckets: where gen_ai_token_semantics
# reads "inclusive", input already contains cache_read and cache_write -
# adding them double-counts. Only input - cache_read - cache_write pays
# the full prompt rate.
Verdict
Grafana Agent Observability is the most complete agent-telemetry product we have tested end-to-end this year, and the October 20 OpenTelemetry GA removes the biggest architectural objection — agent data now rides the same standard, the same exporters, and (mostly) the same semantic conventions as the rest of your stack, so the SDK is an accelerator rather than a lock-in. The evaluation-to-CI loop is real, shippable, and better-integrated with alerting and SLOs than anything in the LLM-observability specialist market; the coding-agent launcher is the fastest audit win in the space; and Grafana's willingness to document its own failure modes — dual pipelines, fail-open guards, cardinality traps, cache-semantics — is rare and makes deployment review tractable instead of hopeful.
Buy it if agents are a production workload in an org that already runs Grafana Cloud: the correlation dividend is decisive, the included allowances make the pilot free, and the trust loop will raise your quality bar within a sprint. Deploy it with three non-negotiables from day one: providers-before-client OTel wiring with a metric canary, fail_open=False on every guard-enabled client with alerting on guard metrics, and a capture-mode decision per surface with the workflow-step side door explicitly reviewed. And budget honestly: at scale you are paying a premium per generation for the platform around it — which is a fine trade if you use the platform, and a bad one if you only wanted traces.
Review methodology: vendor primary sources (press releases, GA blog, product pricing page, five documentation guides, three SDK concept documents, SDK READMEs) read in full on 2026-11-17, plus hands-on execution of the open-source agento11y Python SDK 0.23.0 on Python 3.14 — real span and metric capture via in-memory OTel providers, and real HTTP wire capture of the generation-export payload against a local sink. No Grafana Cloud account, cluster, or paid tier was used; claims about the hosted surfaces (evaluations UI, guards runtime, experiments reports) reflect vendor documentation, clearly attributed. Pricing arithmetic was computed with a Decimal script from the published rates; assumptions are stated inline.